Climate Finance Tracker (CFT)
Led by Vibrant Data Labs (VDL) and housed at One Earth, The Climate Finance Tracker provides funders – from philanthropy and early-stage investors to VCs and institutional investors -- with the most complete, up-to-date view of the flows of finance for climate change mitigation and adaptation efforts, supporting better funder collaboration to achieve the Paris Climate Agreement goals.
The climate crisis is an “all hands on deck” problem – yet in the world of finance, none of the hands can see what the others are doing. It is extremely difficult for funders to effectively address such a systemic problem without, at minimum, being able to easily see who is doing what and what kind of money is going where. In the next decade, trillions of dollars in investment/funding decisions will be made for climate mitigation, adaptation, and hybrid infrastructure projects, and to operate in this complex and high-stakes environment, funders need better intel.
The Climate Finance Tracker offers an intelligence product to help funders make more strategic decisions yielding greater collective impact. Vibrant Data Labs (VDL) is building the first publicly accessible and interactive Climate Finance Tracker to empower all actors with a big picture of climate finance. The goal is to help funders and ‘ecosystem-builders’ explore who is funding what across all climate-relevant sectors, find and convene collaborators, and identify what type of capital could be most effective where.
VDL brings a unique pedagogy and design approach that differentiates this work from previous efforts in the space. VDL CEO (Eric Berlow) and CTO (Rich Williams) collectively have over 50 years of experience in big data, ecology, complexity science, network theory, computational statistics, and data visualization. They have applied this pedagogy to every step of the Climate Finance Tracker data pipeline to let the data tell its own story and to reveal funding patterns that are invisible to the naked brain.
While there have been many attempts to synthesize broad trends in climate finance data (e.g., CPI), these are generally static charts summarizing rigid climate taxonomies from a limited set of funding types. They are laborious to update, usually out of date by the time they are published, and impossible to explore for novel insights. The reader cannot ‘double click’ on a bar chart, for example, to see the specific investors, companies, or sub-themes packaged within the investment set.
The Climate Finance Tracker is designed to:
- Allow users to fully interact with the data -- to see big picture trends, drill down to the details, and conduct custom visual queries of who is solving what and where.
- Provide timely climate finance trends with a robust analytical pipeline that minimizes human effort to update with new data.
- Leverage state-of-the-art machine learning and Natural Language Processing (in partnership with Primer) to let climate themes and topics emerge from and evolve with the language of how investees and grantees describe their work.
- Be publicly accessible and built on a transparent, open-source code base that can support other climate finance synthesis efforts.
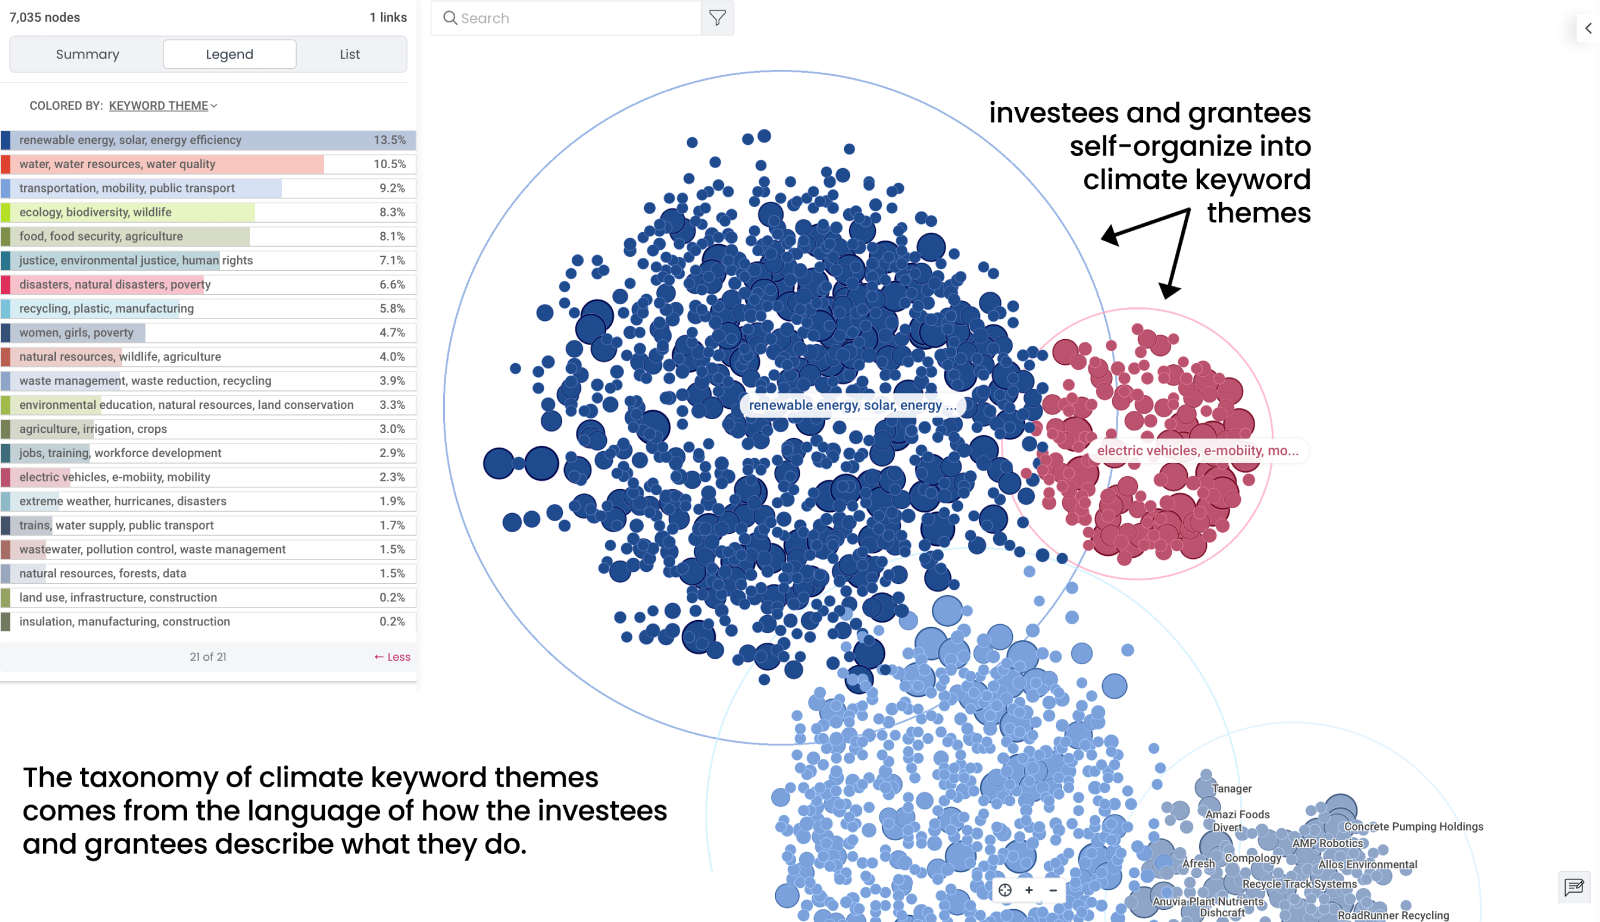
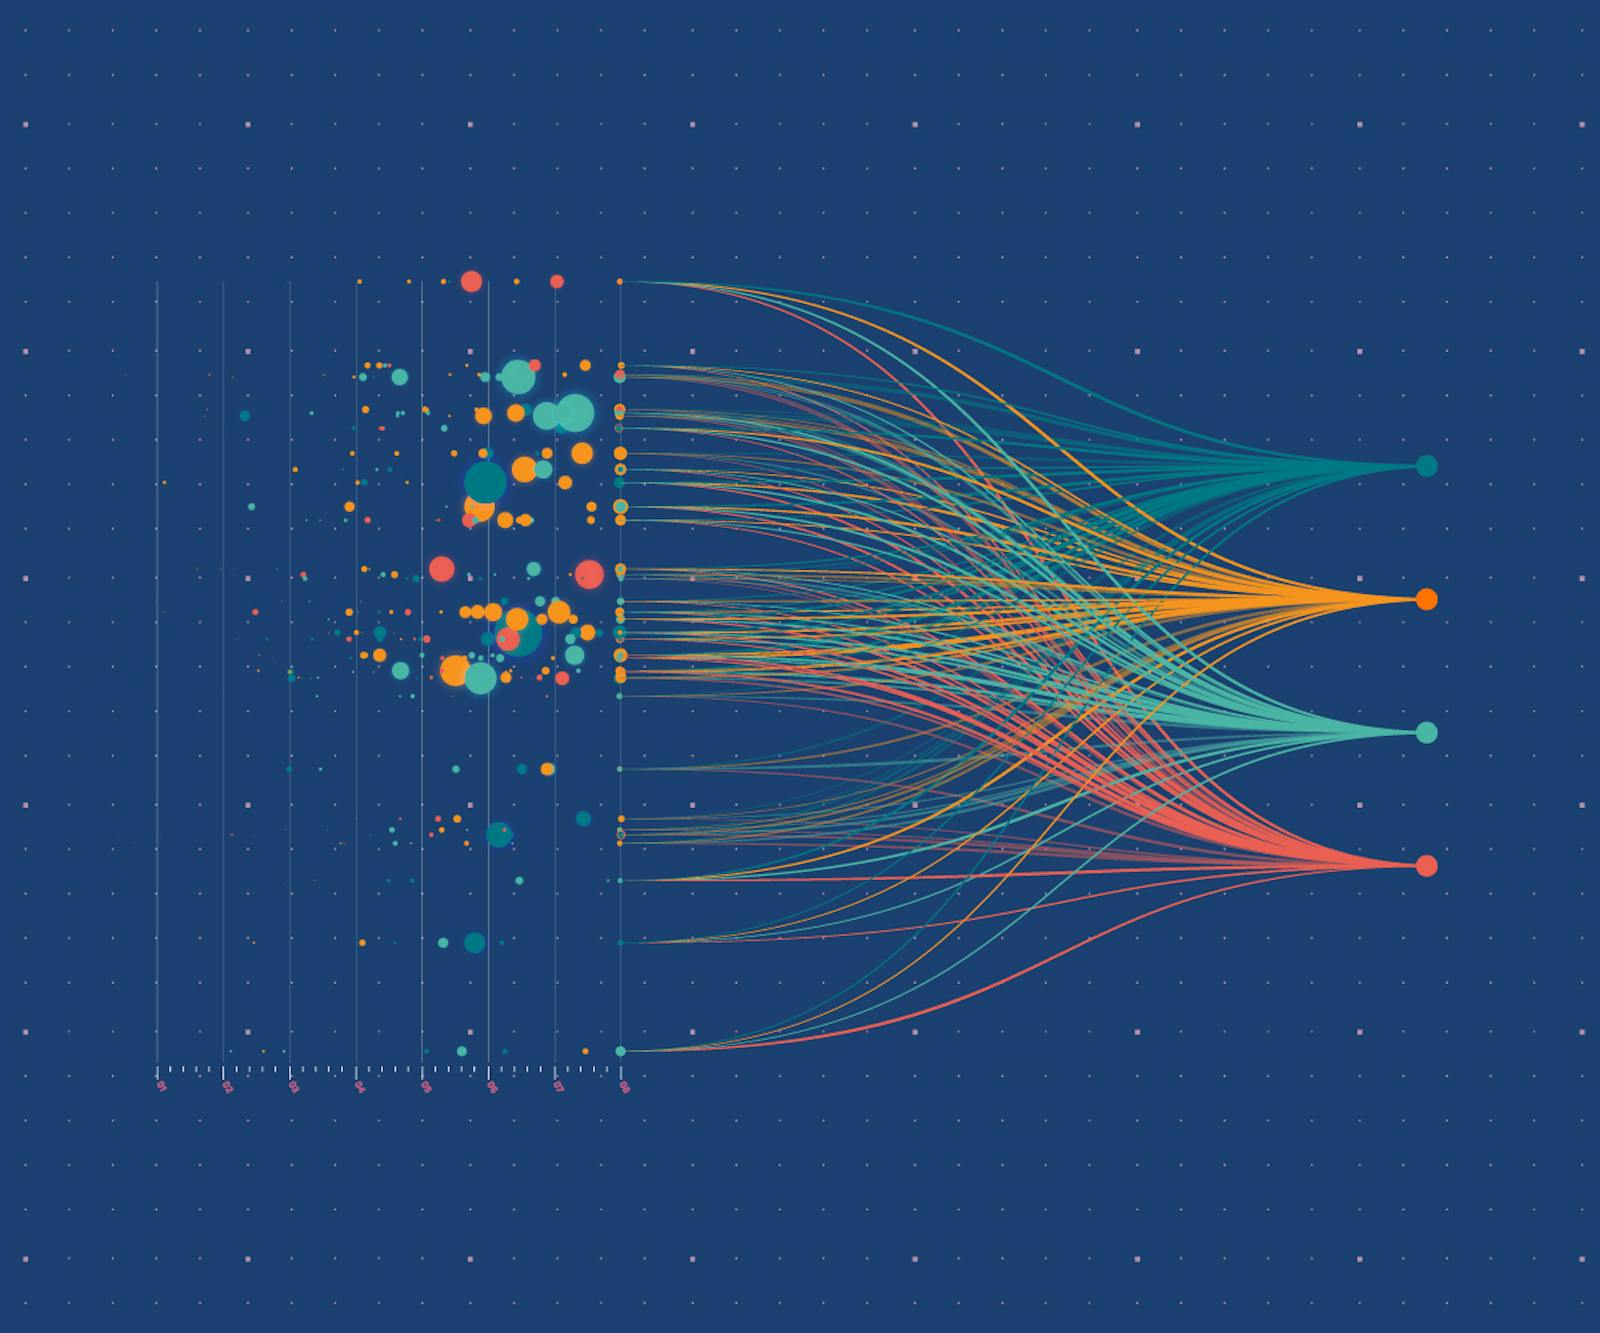
Self-organizing taxonomy with real-time statistics.
The project combined five core capabilities, making it entirely unique amongst initiatives focusing on climate finance:
1. Raw Data Processing
- The framework can accommodate data from a wide range of funding types, sources, and geographies as long as they meet simple minimal standards.
- The criteria for including or excluding funding data in a given climate funding ecosystem are transparent, flexible, and easily updated.
- Deep Learning models are used to filter out companies whose description matched a broad climate search term, but the company is not semantically relevant (e.g., “In this political climate…” matches ‘climate’ but is not relevant).
2. AI Data Enrichment
- VDL and Primer.ai are co-developing a unique keyword tagging tool that enriches each funded organization with climate-relevant keywords derived, bottom up, from the language of how they describe what they do.
- The keyword taxonomy is flexible and can evolve to accommodate changes to this rapidly evolving field.
3. Data Analysis and Compilation
- VDL leverages network theoretic methods for letting funded companies and organizations self-cluster into broad themes.
- This clustering method allows a broad climate sector taxonomy to be defined by (and evolve with) the data, and it simultaneously highlights trends, gaps, and cross-sector affinities that would be otherwise invisible.
- A unique synthesis of multiple funding types (e.g., private grants vs. investments) provides context for each that is impossible to see otherwise.
4. Data Visualization
- VDL is leveraging and building upon an open-source interface for visual exploration of high-dimensional data that was previously created by the team in their startup, which was acquired by Rakuten.
- Instead of using data visualization to tell linear data stories – VDL is creating a visual data interface to empower easy visual searching and discovery of climate funding data.
5. Openness:
- The code to process, enrich, analyze, and visualize the data are open-source.
- Where possible, all the maps are public.
- This openness has paved the way for unique synergistic partnerships with data providers (e.g., Crunchbase and Candid), state-of-the-art Natural Language Processing experts (Primer.ai), and finance data journalists (ImpactAlpha.com).
- Each piece of the analytical pipeline is modular to allow it to contribute to data enrichment, analysis, or visualization of custom or proprietary data for individual partners.
.png "Multi-summary views, descriptions, and explorable tags")
Multi-summary views, descriptions, and explorable tags.
VDL Team
● Dr. Eric L. Berlow is an ecologist and complexity scientist. Eric previously co-founded a visual data interface company which was acquired by Rakuten in 2016 - where he then led data product innovation from the world's largest e-commerce panel. Eric was the founding director of the University of California’s first science institute in Yosemite National Park, where he co-led efforts to leverage data and computation for evidence-based conservation policy. Eric's research on ecological complexity - which includes publications in Nature, Science, and the Proceedings of the National Academy of Sciences - has been recognized as being in the top 1% most highly cited papers in the field. He is the recipient of a TED Senior Fellowship, an Alexander von Humboldt Fellowship, and a National Science Foundation Postdoctoral Fellowship; and was listed among the Top 100 Creatives by Origin Magazine. Eric received a B.A. in Biology from Brown University and a PhD in Ecology from Oregon State University.
● Jay Hirschton has nearly two decades of leadership in the social impact sector growing and scaling organizations. As CEO of Full Circle Fund, Jay led the organization through six years of transformational growth, increasing both the annual budget and size of the team by 300%. He also led the team to develop its first-ever Theory of Change and Racial Equity plan, shift to a Human-Centered Design framework, and design new innovative programs. Previous to Full Circle Fund, Jay led fundraising, programming, and operations for national nonprofit organizations buildOn, Common Sense Media, and Burton Snowboards Chill Foundation. Jay is a fellow at the Stanford d. School – Designing for Social Systems and Board Chair for the Hatch Network. Previously he served as the City Commissioner for the City of Berkeley and a Board Member for several local and global nonprofit organizations. He attended the University of Colorado at Boulder and is a graduate of the AltMBA program. He lives in Berkeley with his wife and two boys.
● Dr. Rich Williams is a Data Science, Complex Networks, Machine Learning, and Theoretical Ecology expert. Rich is an experienced and highly published data and research scientist with excellent analytic and computational skills and a skilled software developer experienced at releasing software products. Rich has extensive experience implementing scientific and statistical techniques, including machine learning, non-parametric statistics, and mathematical modeling as well as in software system design, user interface design, and scientific visualization. Through this experience, Rich analyzed complex, nonlinear systems and complex networks with applications to problems in economics, social science, biology, medicine, and environmental science. Rich holds specialties in data analytics, data science, statistical modeling, machine learning, deep learning, graphical models, Monte Carlo methods, mathematical modeling, dynamical systems, nonlinear systems, network analysis, network visualization, scientific visualization, data modeling, systems biology, ecology, ecological modeling, population dynamics, ecoinformatics, knowledge representation, ontologies. Software: C#, C++, C, Java, Javascript, Python, R, Matlab, OpenGL, WebGL, XML, RDF, OWL.

Sign up to receive monthly updates about our work.