High resolution and current data are needed to create a sustainable food system


Sustainably feeding 10 billion people on a warming planet is one of humanity’s grand challenges. So how are we doing? A team of global leaders in science, business, and development recently presented an assessment in their report, Actions to Transform Food Systems Under Climate Change. They graded several factors that characterize sustainable, inclusive, healthy, and climate-resilient food systems. The good news: the quantity of food produced and human health and nutrition are improving. Regionally, there are major problems of food accessibility and rural poverty. More broadly, food production has an increasing impact on warming the planet, degrading water quality, depleting water sources, and destroying natural habitat. Overall grade = “Cause for Grave Concern.”
Broad assessments and strategies are very useful for identifying large scale issues and setting a broad scale agenda. But higher resolution data are essential for building a detailed roadmap within every country in the world. The food system is complex. Developing solutions at a scale relevant for policies requires better data. Over the last decade and a half, my colleagues and I have created and analyzed data on which crops are produced where, the resources needed to grow them, what they’re used for, their environmental impact, and with whom they are traded. Many of the data sets are available at EarthStat.org
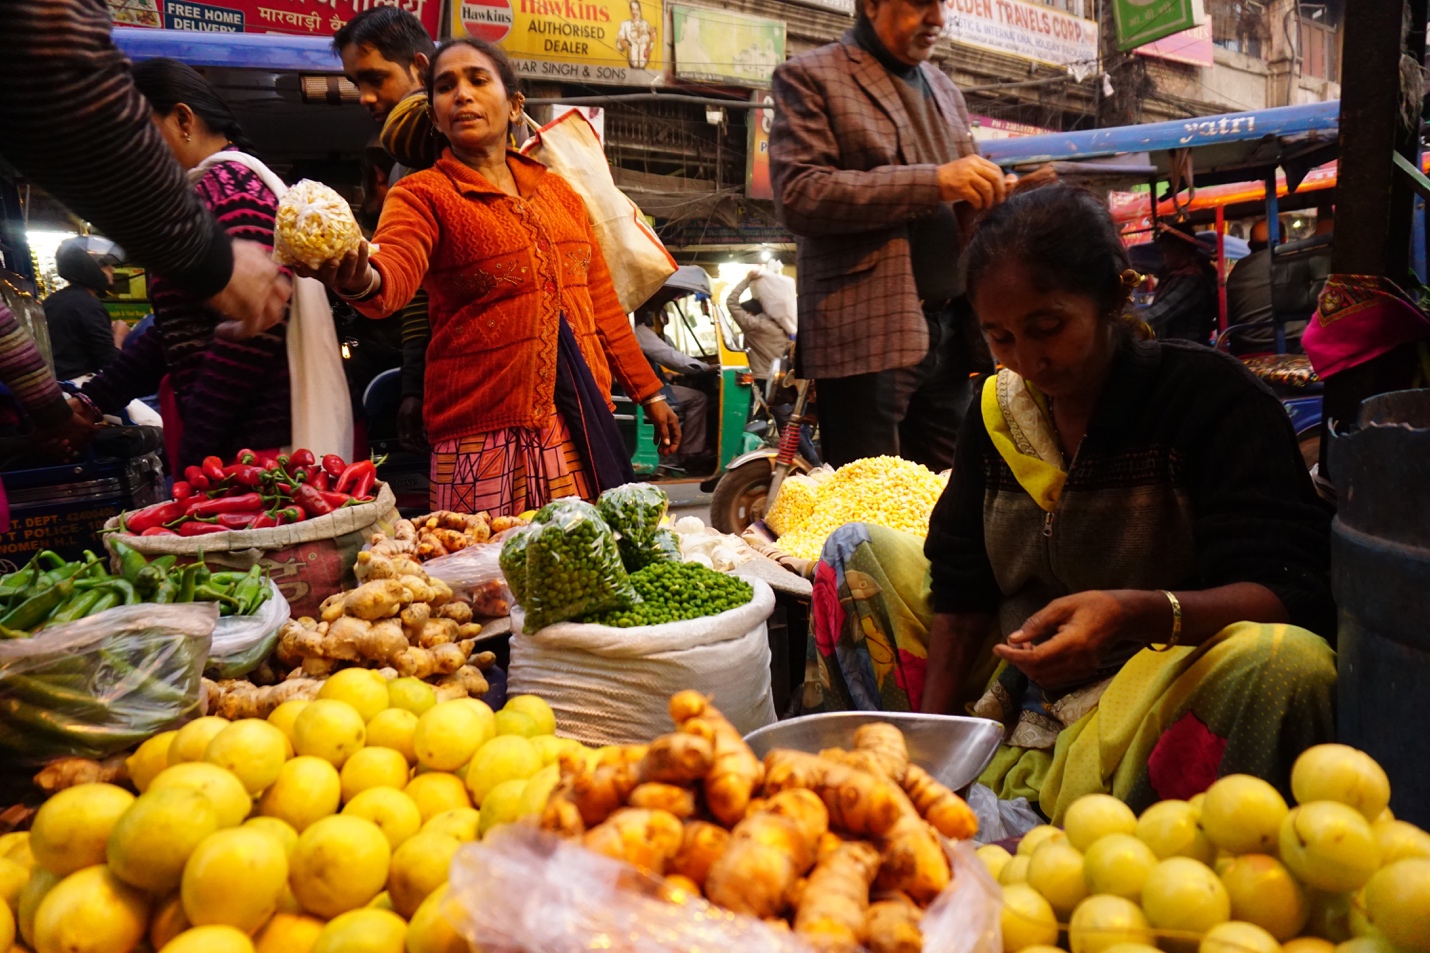
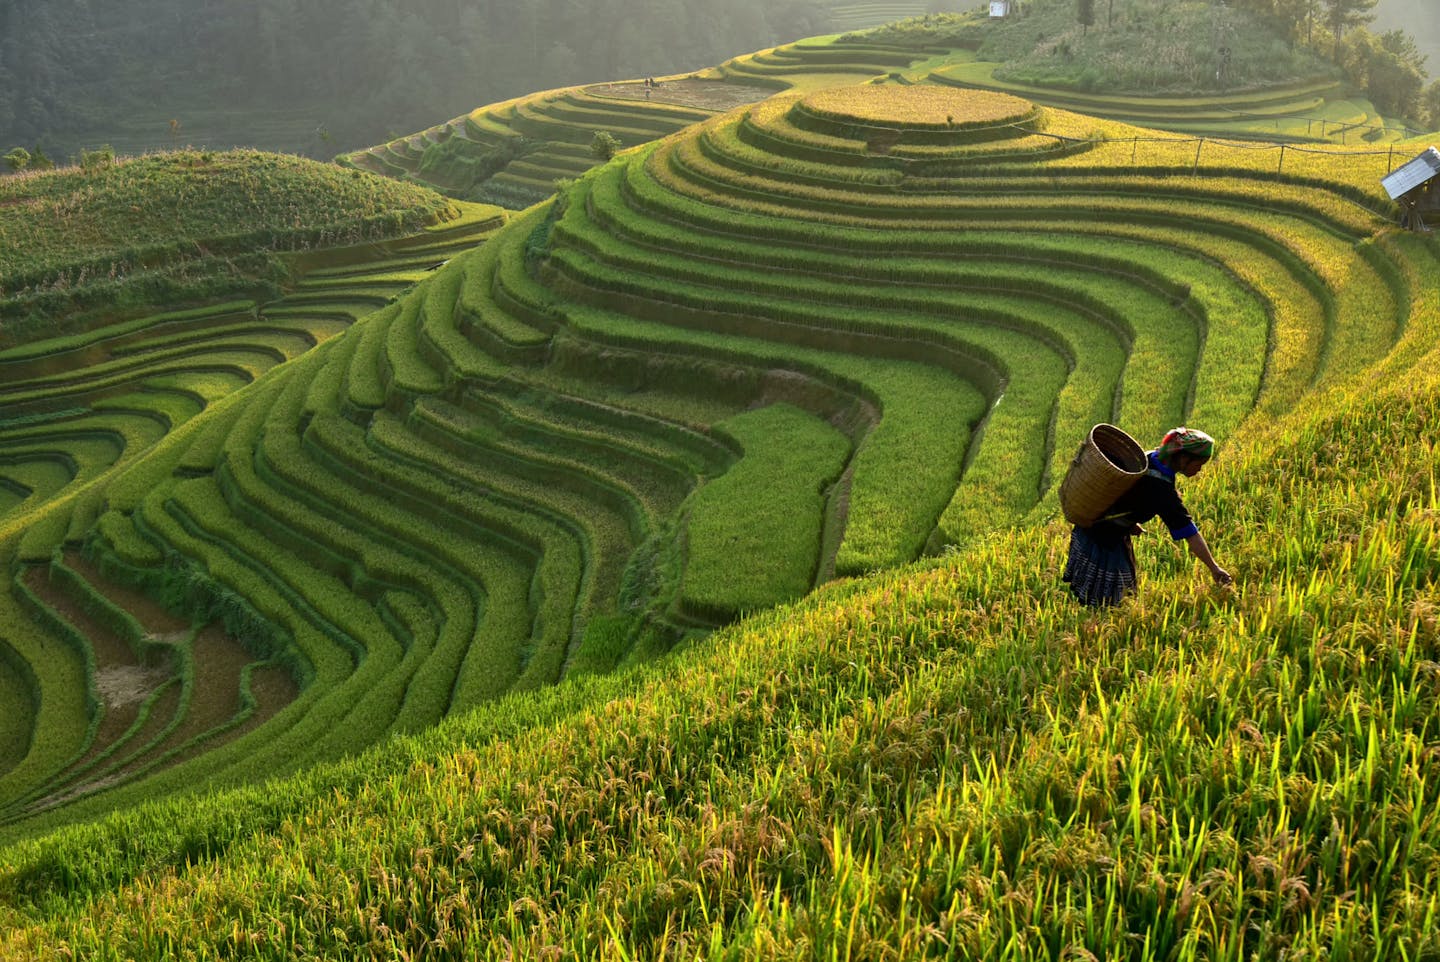
Image credit: Stephanie Liao, Creative Commons
What’s grown where?
Satellite data has revolutionized how landcover is mapped across cities, countrysides, and remote areas. Mapping the world’s croplands is challenging but doable. Mapping specific crops, however, is so challenging that it’s only been done for a few crops in a few regions. Agricultural census data provides data on which crops are grown within a country, state, or county. By combining the where from satellites and the what from census data, we get a detailed understanding of both the what and the where our food comes from.
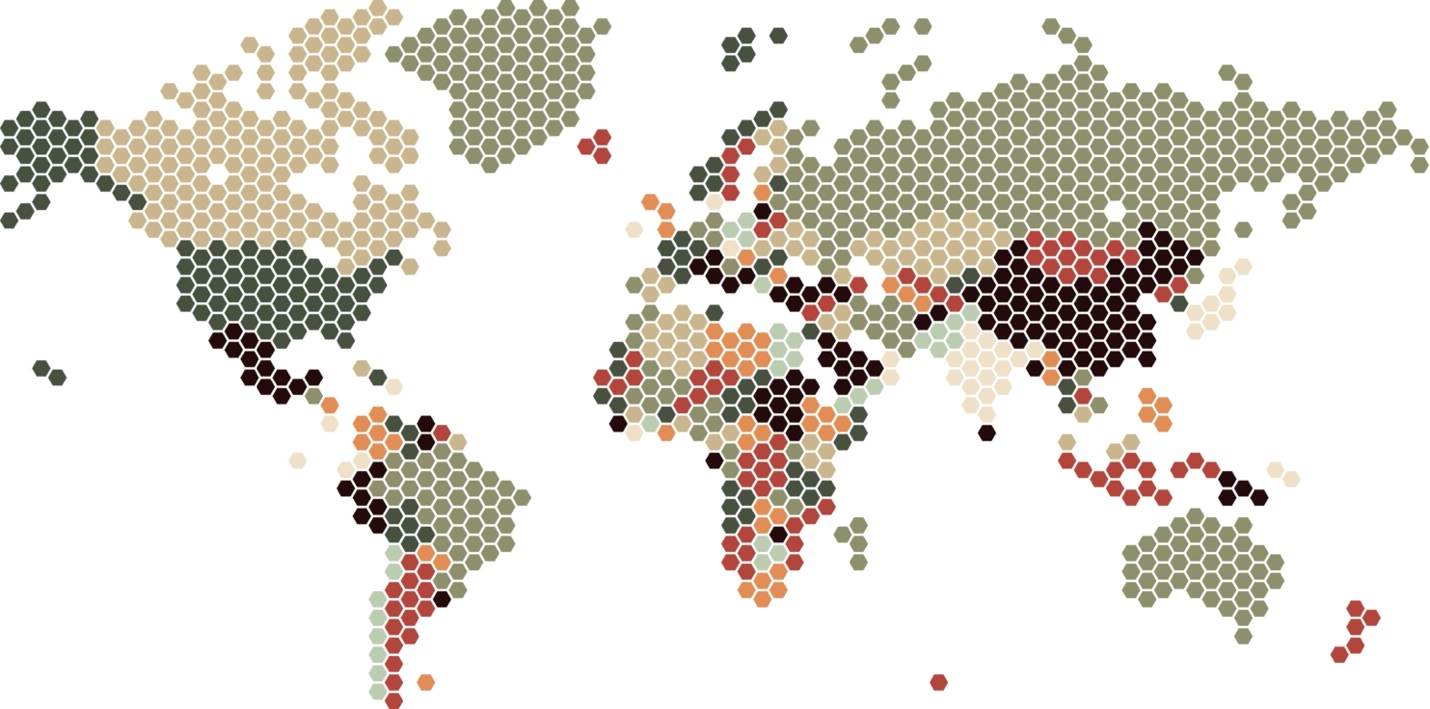
Satellite and crop census records can be combined to map where crops are grown and how much is produced. This map shows the total amount of calories produced by major crops. Data: West et al. 2014, Science.
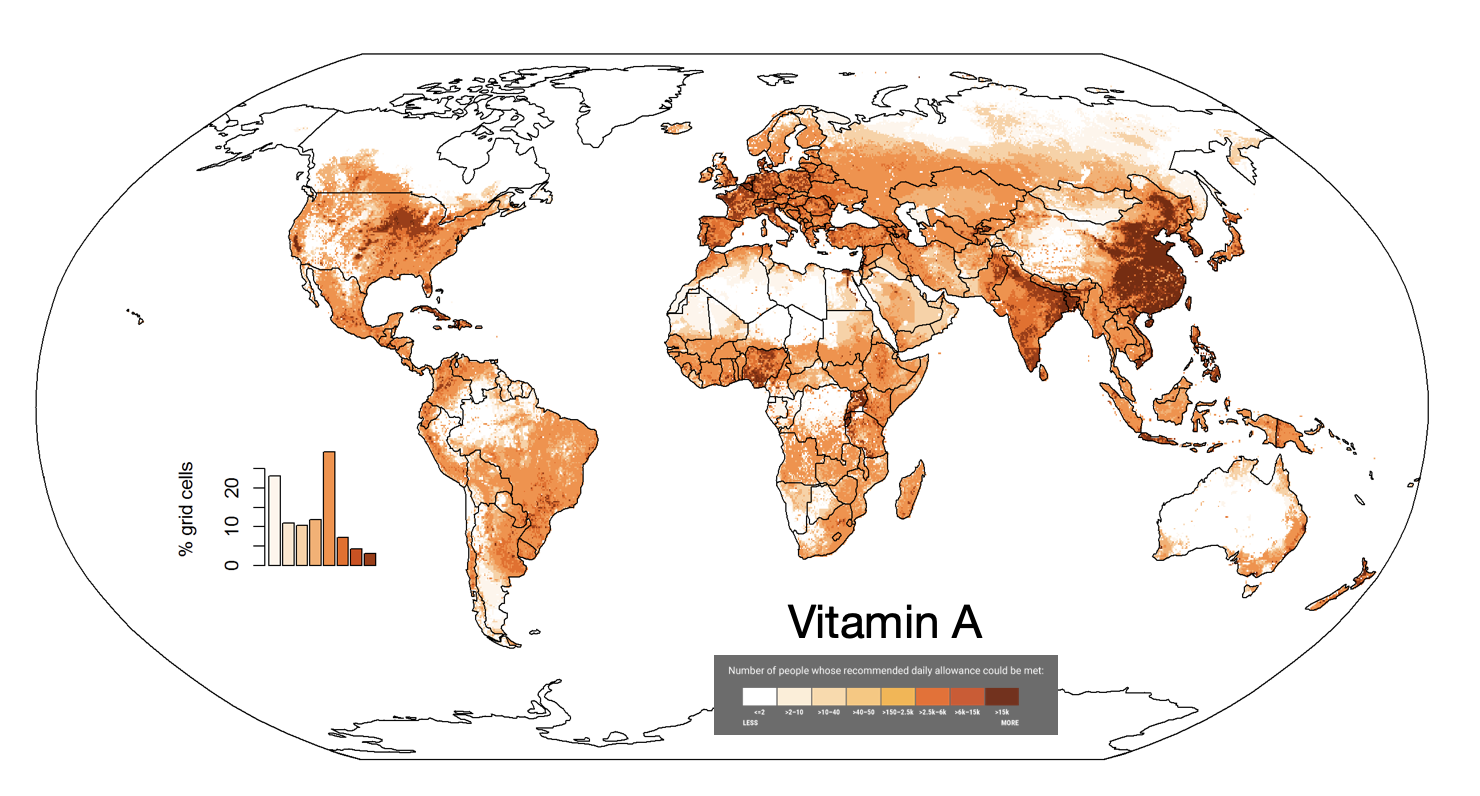
By combining production and nutrition data for each crop, we can map where essential micronutrients are produced. Data from: Herrero et al. 2017 Lancet Planetary Health.
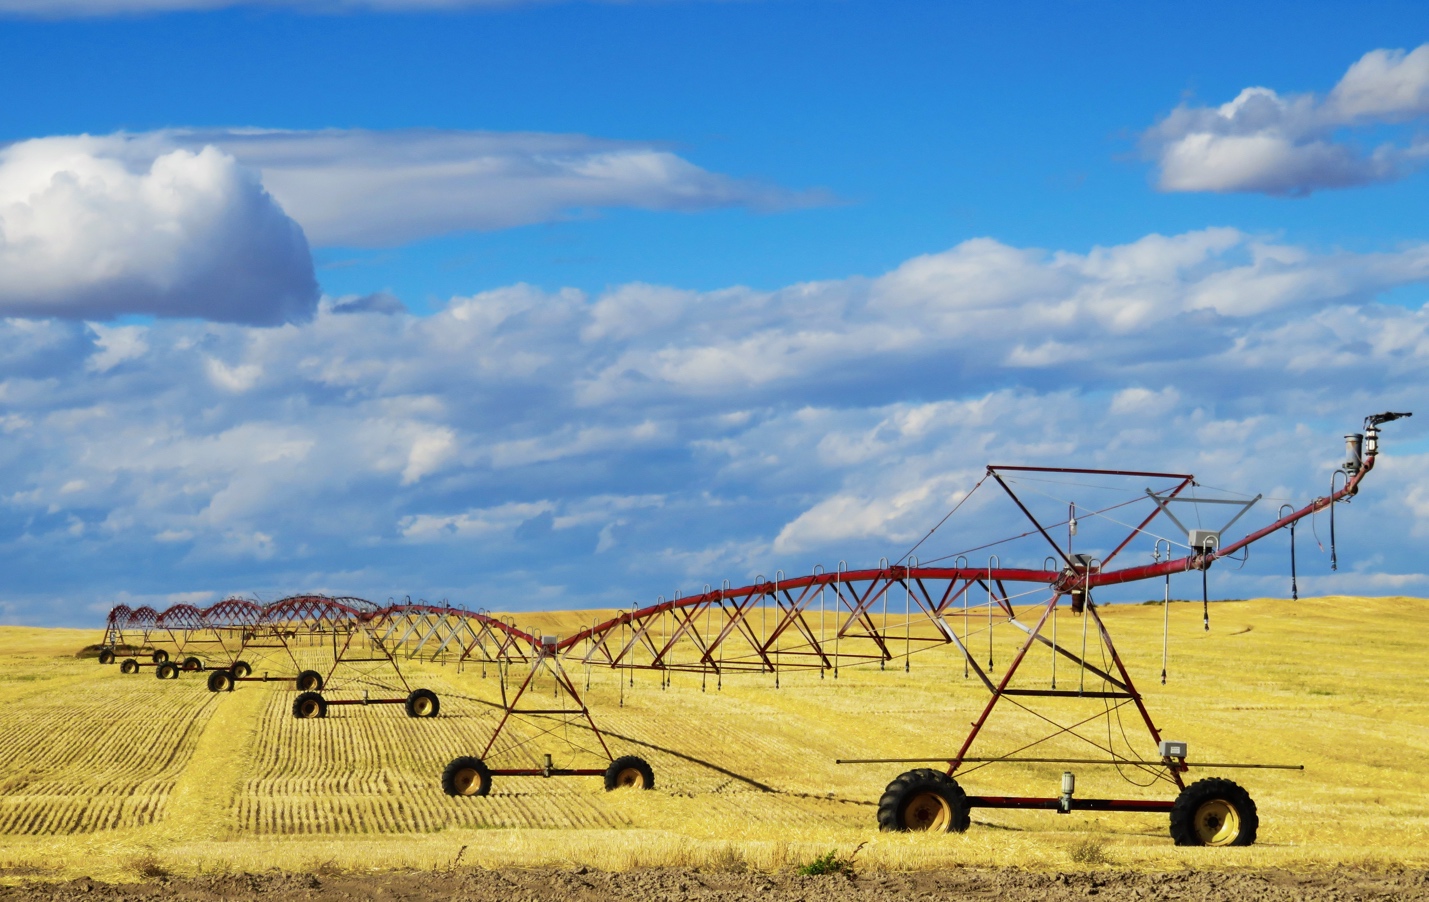
Image credit: Peter Gonzalez, Creative Commons
Resource use
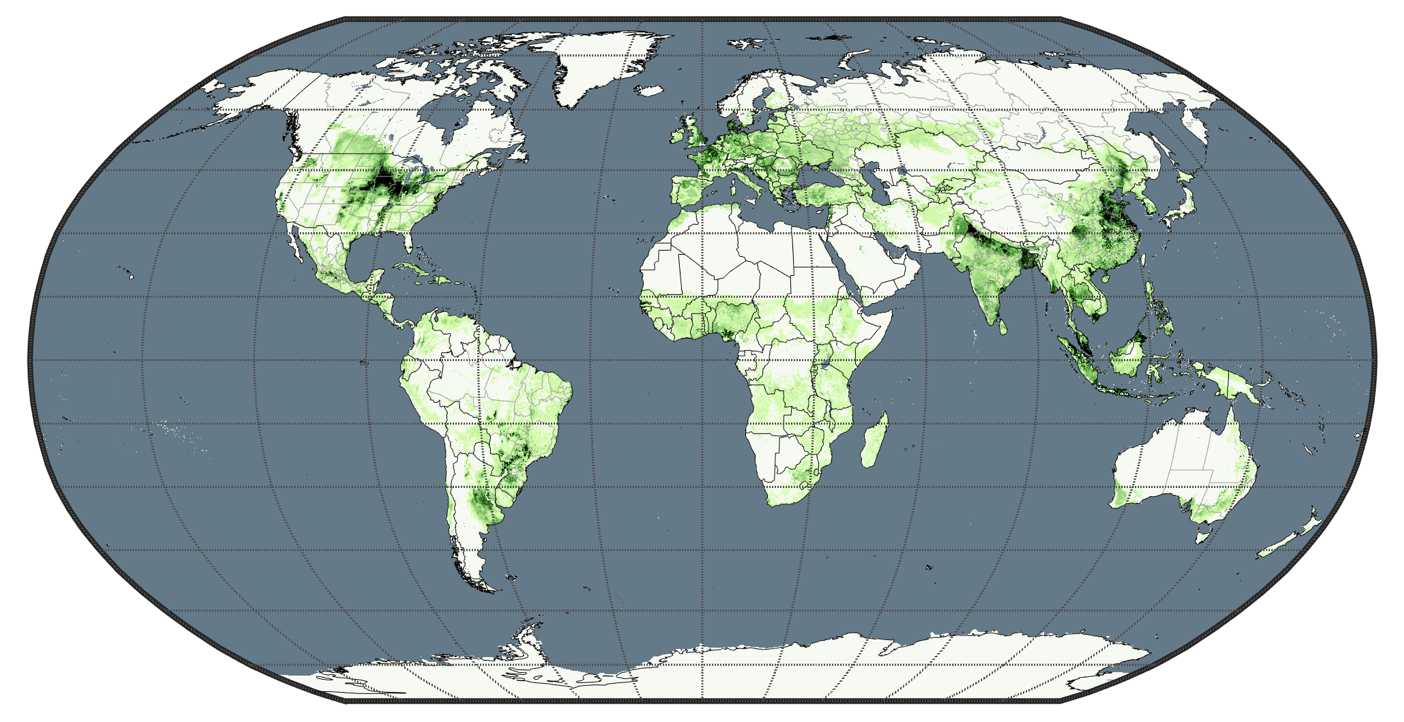
Tremendous resources are used to produce food. Globally, agricultural lands cover 40% of the ice-free land on earth. 70% of all water use on the planet is for irrigation. Fertilizer is one of the biggest sources of water quality problems. Plowing and land clearing can lead to soil loss. The list goes on. With information on how crops are managed, we can get a sense of what influences crop production as well as environmental impacts. For example, fertilizer application rates can be "mapped" onto the crop production data. The same can be done for other crops and other management practices. Similar approaches have been used to map irrigation for crops or feed for livestock.
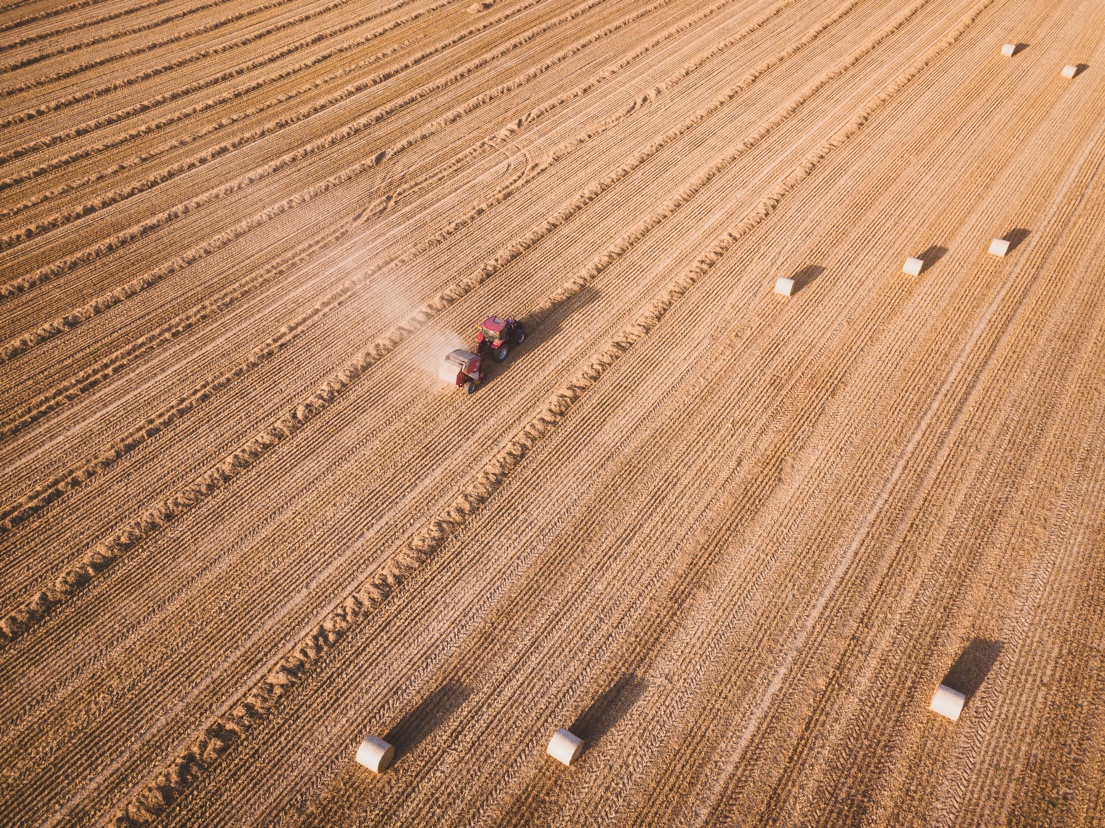
Image credit: Ivan Bandura, Creative Commons
Insights from data integration
We can assess many critical issues by integrating these data. For example, data on production, management, use, and nutrition can be combined to assess how using crops for food vs. feed effects food security. Here are a few other examples:
• How much irrigation water is used to produce alfalfa grown in the water-stressed southwestern US that will be exported?
• How much oil palm production in Indonesia is linked to deforestation?
• Which places are likely to be most suitable to grow oranges in a moderate climate change scenario? What about an extreme climate change scenario?
• Which crops have the highest greenhouse gas emissions coming from their production? Where are the global or sub-national hotspots?
• Where are crop yields underperforming in Western Africa? How much could they be increased?
• Where is most of the vitamin A produced on croplands? Are these places at high or low risk for climate change?
• Which crops are using the most irrigation in water-stressed areas? Can they be grown more efficiently?
• Which areas are already experiencing more extreme heat days? What’s grown there and how would a drought there affect regional or global food supply?
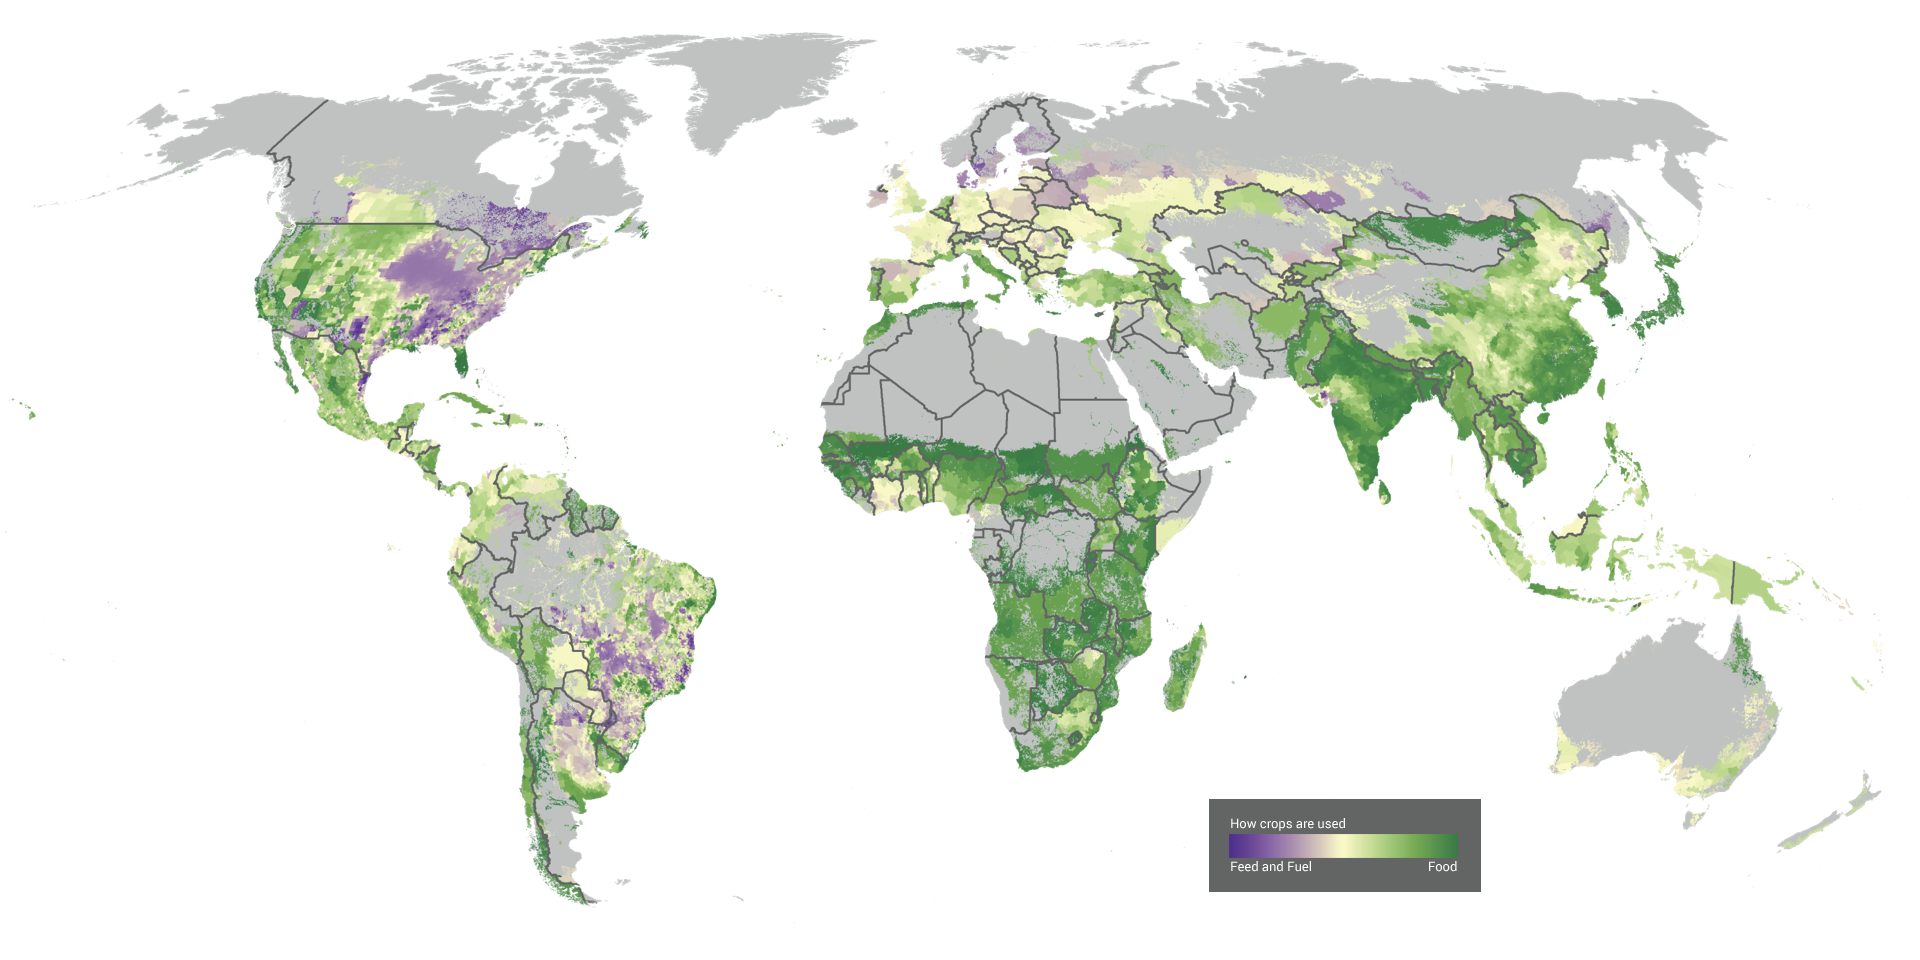
How we use what we produce effects food security. Globally, more than a third of calories produced on croplands are used for animal feed. What if some of the land used to grow feed was used to produce grains, fruits, and veggies that we eat? Data from: Cassidy et al. 2013, Environmental Research Letters.
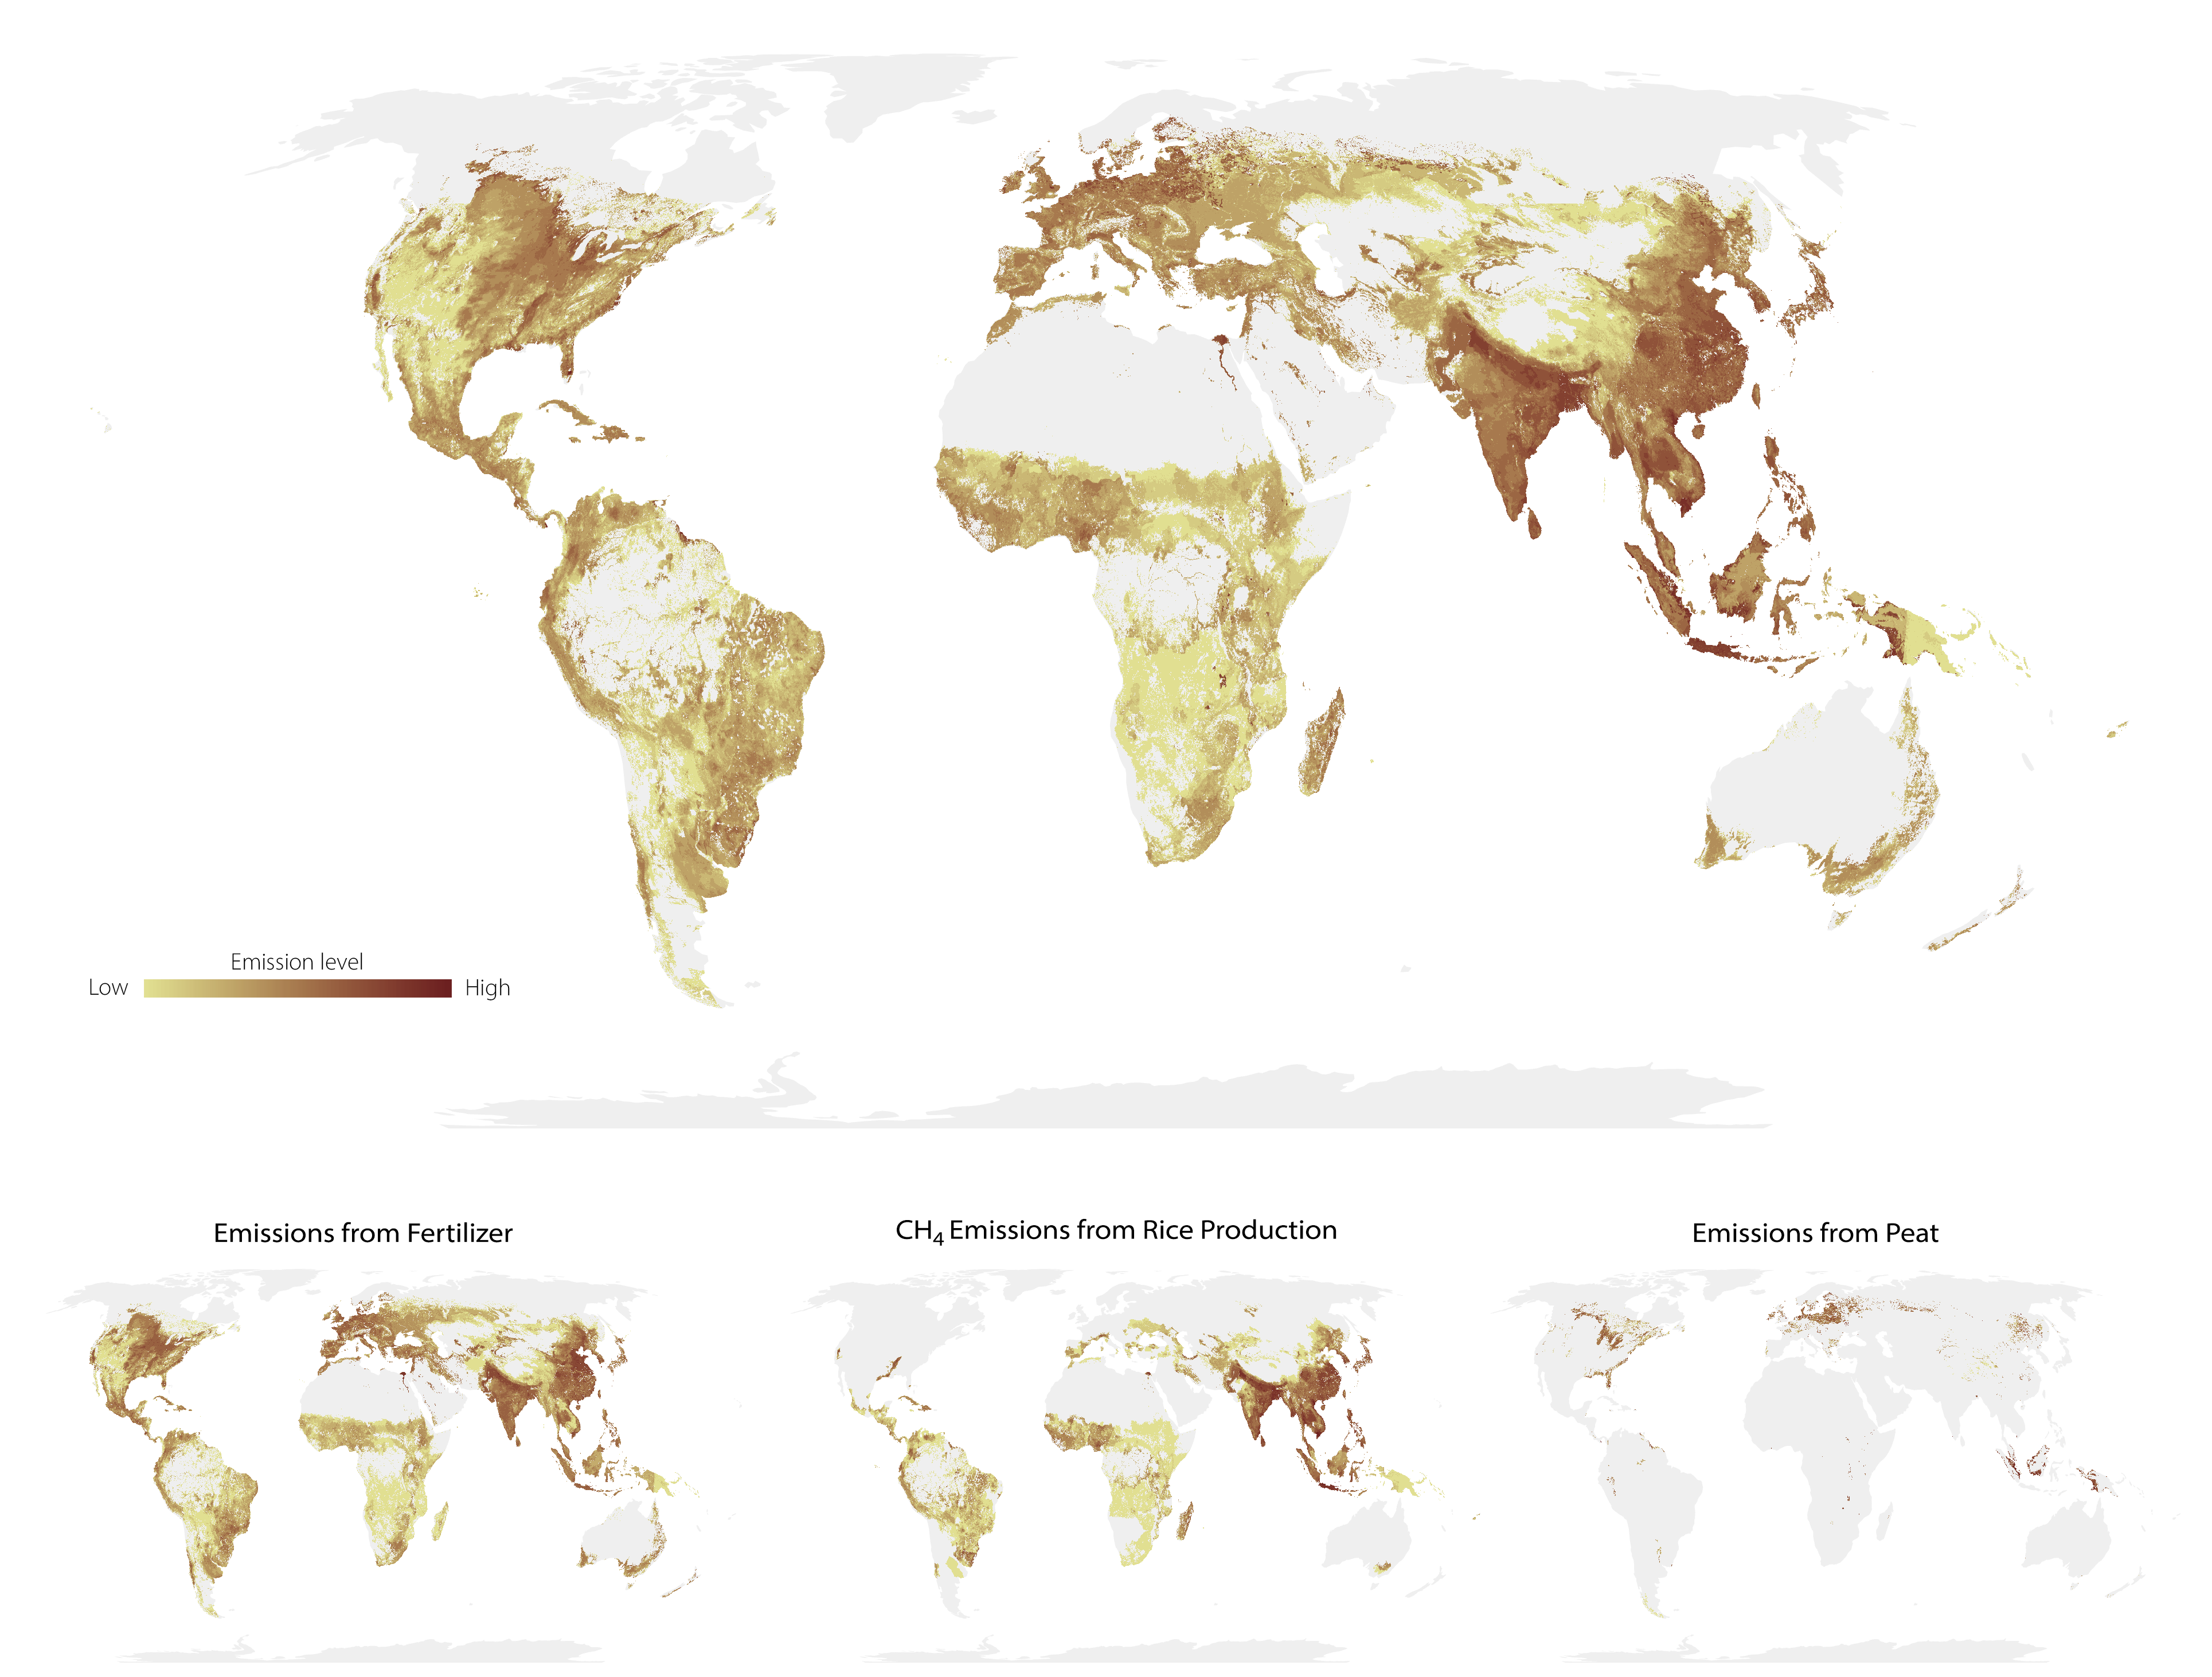
How we manage farm fields affects both food production and environmental impacts. Croplands emit nitrous oxide from applying nitrogen fertilizer, methane from flooding rice fields, and carbon dioxide from draining peatlands. These emissions all warm the climate. Changing management practices can be a win-win for both boosting production and decreasing environmental impacts. Data from: Carlson et al. 2016, Nature Climate Change. Map created by Bojan Savric, Esri.
Data in demand, but not on demand
Detailed food production data are in high demand. Scientists have cited the original article describing the data over 1,300 times. Our team's related research has been cited over 10,000 times in the last decade. Citations are a good indicator of research's influence on the science community. But the research's impact has gone far beyond dusty (now virtual) university libraries. Insights from these data shaped the kickoff article in National Geographic’s series on food. They are part of the globe-trotting museum exhibit, Our Global Kitchen: Food, Nature, and Culture, developed by the American Museum of Natural History. Esri—the leading software company for managing, analyzing, and mapping geographic data—used the data and related research to illustrate how the world has changed through its The Living Land story map.
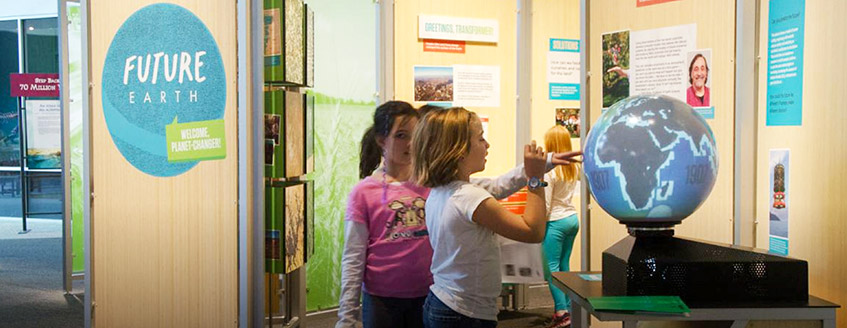
Image credit: Courtesy of Science Museum of Minnesota
Unfortunately, the data sets are now out of date. Much of the map data for crop production is for around the year 2000. A lot has changed since then. And the pace of change is accelerating. Food production is increasing. Diets are changing. The resources used to produce this food is having more environmental impact. To track the major changes in the food system and emerging risks and opportunities, we developed detailed data for ten major crops. These crops make up ~83% of all calories produced on croplands. But that’s not enough. These crops are grains, sugars, and oils. Data on where fruits, vegetables, nuts, and greens are grown need to be developed to get a more complete picture of nutrition.
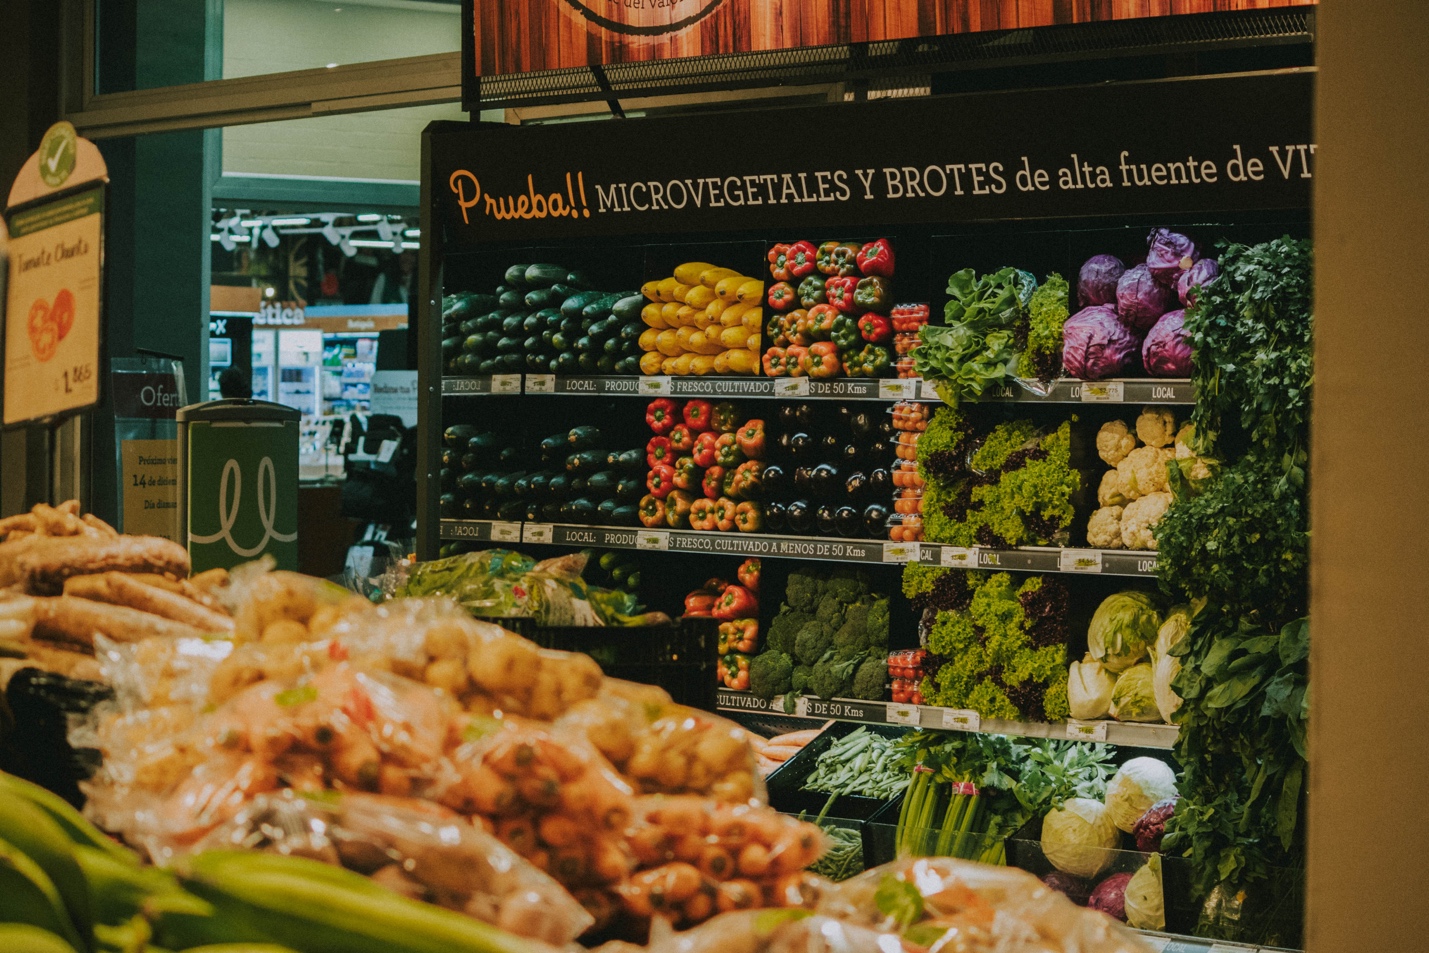
Image credit: nrd, Creative Commons
Despite the demand, the data cannot be produced on demand. The UN’s Food and Agriculture Organization provides annual country-level estimates. As mentioned above, that level of detail is helpful for broad assessments but is insufficient for detailed plan action plans. We've tried to bridge the gap between global and local data. We’ve amassed food production data from over 20,000 counties and states across the world. Some of the data records are downloadable as spreadsheets from government websites. Others records are in digital reports. In some cases, getting the data involves translating hardcopy reports from individual states written in dozens of languages. Yes, it’s tedious and time-consuming. Data is in high demand, but hard to produce on demand.
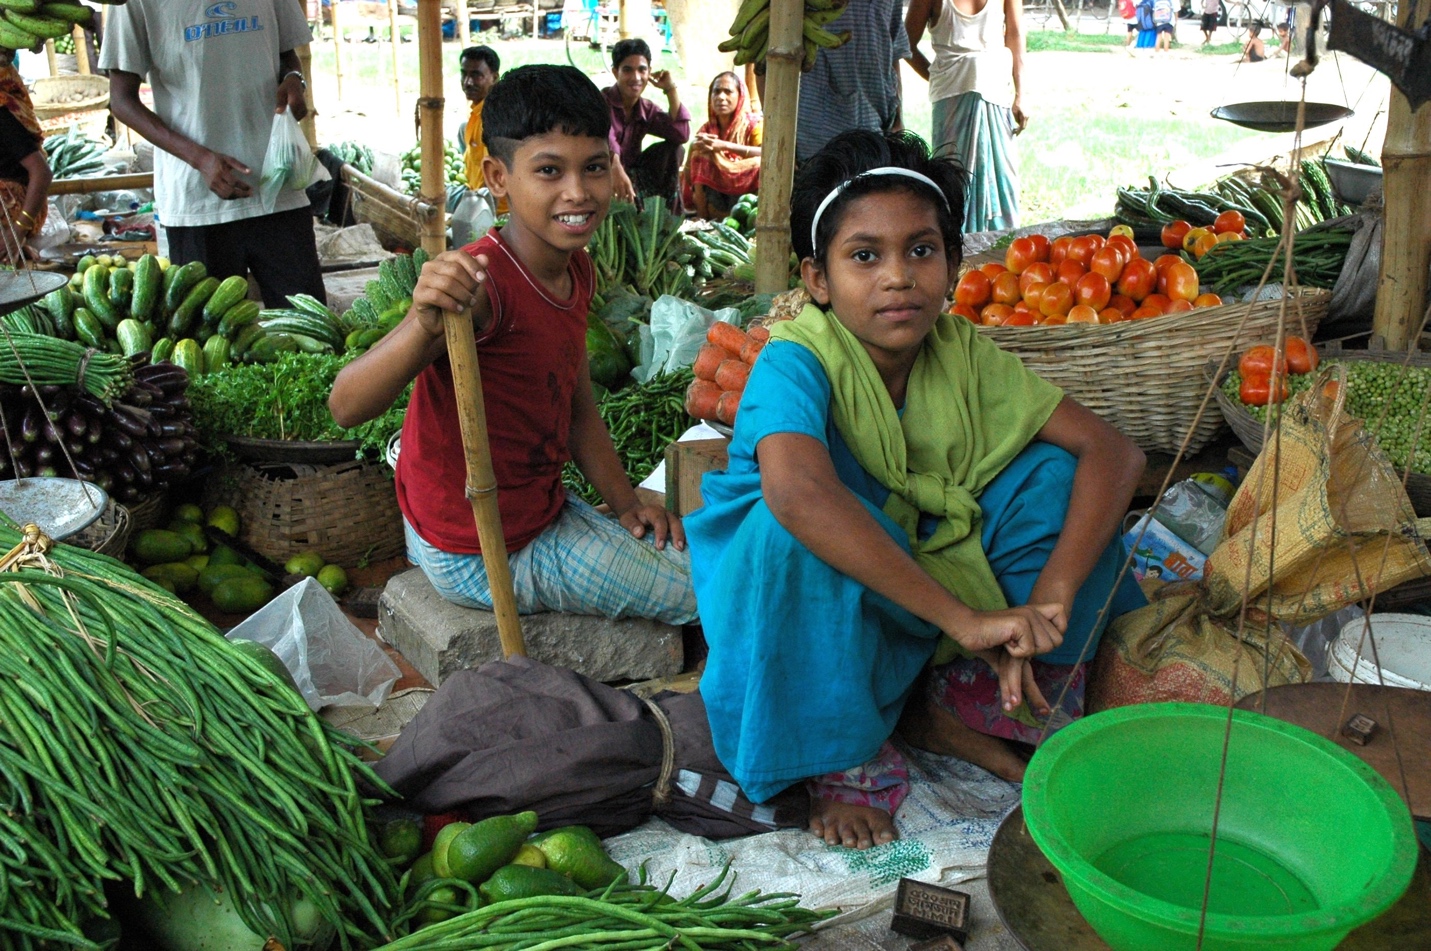
Image credit: Wonderlane, Creative Commons
Future data development
Much of the process for updating these data sets will remain tedious and time-consuming. If it was easy it would have been done already. Future efforts can explore ways of streamlining the current approach as well as using new data sources. Web-crawlers can more efficiently locate agricultural production statistics. There’s also a wealth of untapped sources for developing these data sets. Image recognition can locate geo-referenced photographs of specific crops. Collaborating with existing crowd-sourcing initiatives is another potential data source. Together, these new sources and methods will create the next generation of data. These data are essential for building a roadmap toward sustainably feeding 10 billion people on a warming planet.

Subscribe to receive monthly updates on climate solutions, environmental heroes, and the profound beauty and wonder of our shared planet Earth.