Webinar recap: Greg Asner and carbon emission imagery
Each Wednesday, One Earth will be featuring a webinar recap from organizations and scientists around the world that focus on important topics such as biodiversity, conservation, food justice, and the intersections of environmental and human health.
Greg Asner, the Director of ASU’s Center for Global Discovery and Conservation Science and One Earth advisor, is an ecologist recognized for his exploratory and applied research on ecosystems and climate change at regional to global scales. Asner’s work in Peru, and with their Ministry of Environment, has led to breakthroughs in mapping forest carbon stock and emissions. Forest carbon stock is the amount of carbon that has been taken from the atmosphere and stored within a forest ecosystem. He reveals that even 3 years ago, switching from carbon stock mapping to carbon emissions mapping would have been very difficult if it wasn’t for collaborations and technology advances. Mapping forest carbon with LiDAR, a method for measuring distances by illuminating the target with laser light and measuring the reflection with a sensor, emerged in the 80s and gained popularity in the 90s.
Asner’s team in collaboration with Planet (formerly Planet Labs) developed an indicator of forest carbon stocks and emissions using satellites with plans for this technique to go global. Partnering with Planet proved to be a great match, as their company’s goal is to image the entirety of the Earth daily to monitor changes and identify trends. The team started with a question, “How do we monitor carbon stocks and emissions on a monthly basis for humid tropical biome worldwide?” Why is this question important? The world loses roughly 40 football fields per minute of tropical forests, mainly causes by poorly informed economic incentives. Due to this, tropical deforestation has now turned the world’s largest terrestrial carbon sink into our second largest source of global emissions.
To put it simply, the equation Asner and his team used is: forest area change estimate times the forest carbon estimate is equal to the carbon emissions estimate. Asner explains, “The essential measurement is one that takes scientists from looking down on forest to understanding their vertical structure.” This is important if an individual lacks the training to understanding spectral properties from trees above, as there may be a confusion between small and tall trees which will completely skew carbon results.
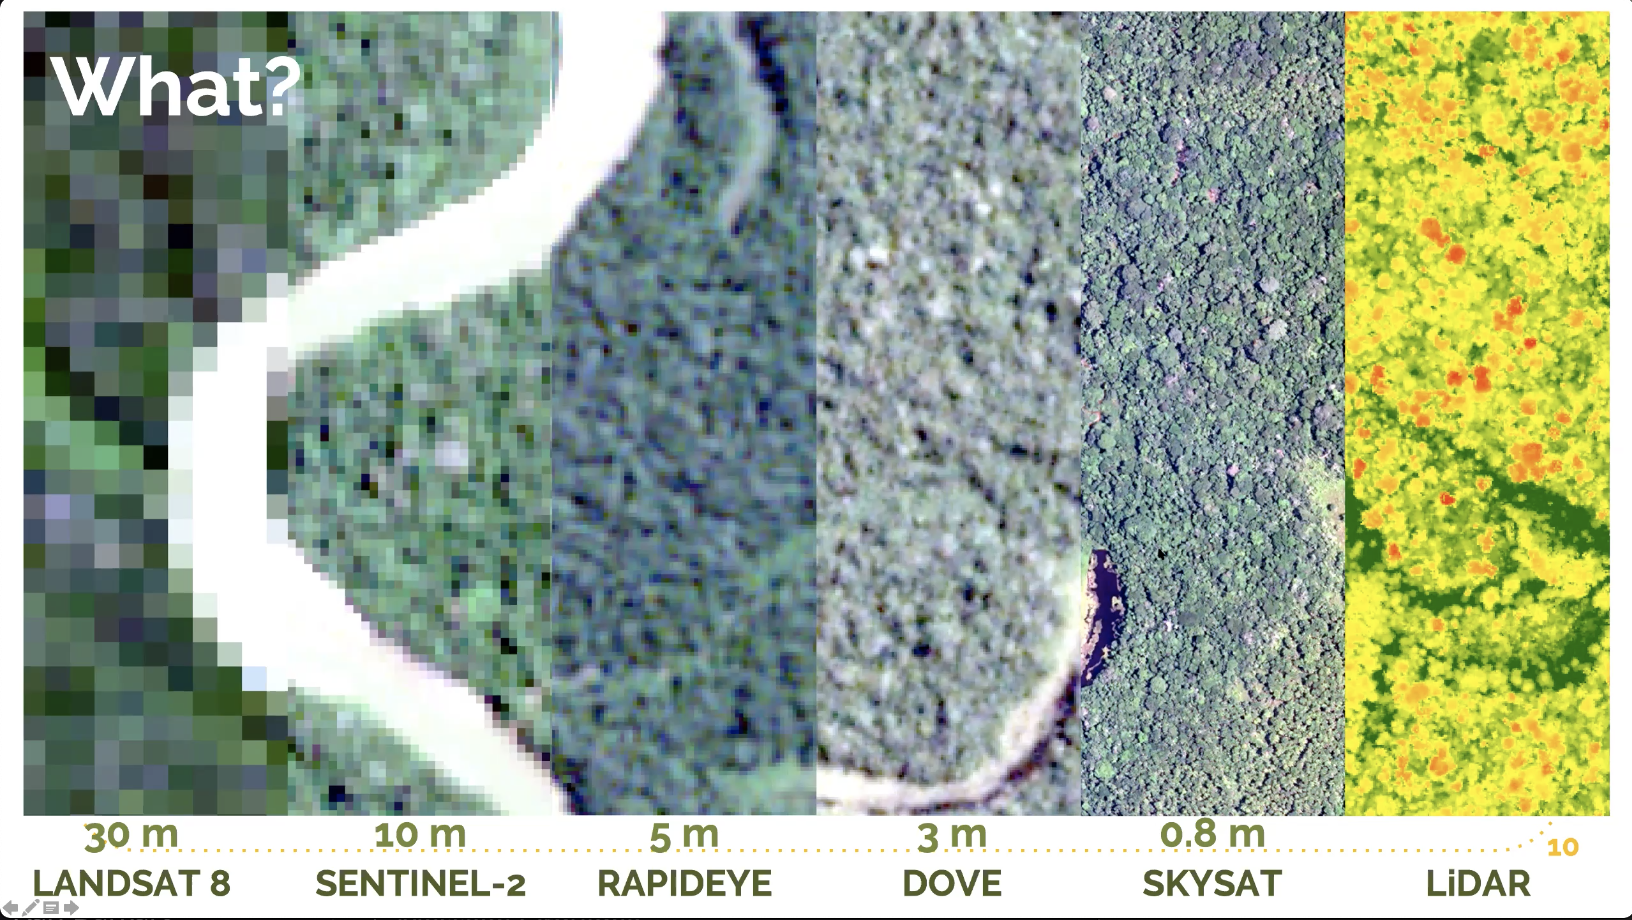
Graphic depicting different satellite imagery and its resolution in analyzing forest data. Image credit: Courtesy of Greg Asner
By 2011 Asner’s team was mapping forest carbon stock using LiDAR and converting this information into knowledge on how much carbon is being stored and lost in the Amazonian and Andean landscapes. Over the years, Asner’s team has flown above the Peruvian amazon and Andean region to collect the forest’s 3D structure with airborne LiDAR. The end goal of this process is to eventually make these forest maps well enough so they can replace the LiDAR data with satellite data and gather above ground estimates of carbon stocks. With this assessment done over time, it could accurately depict and help scientists understand carbon gains and losses.
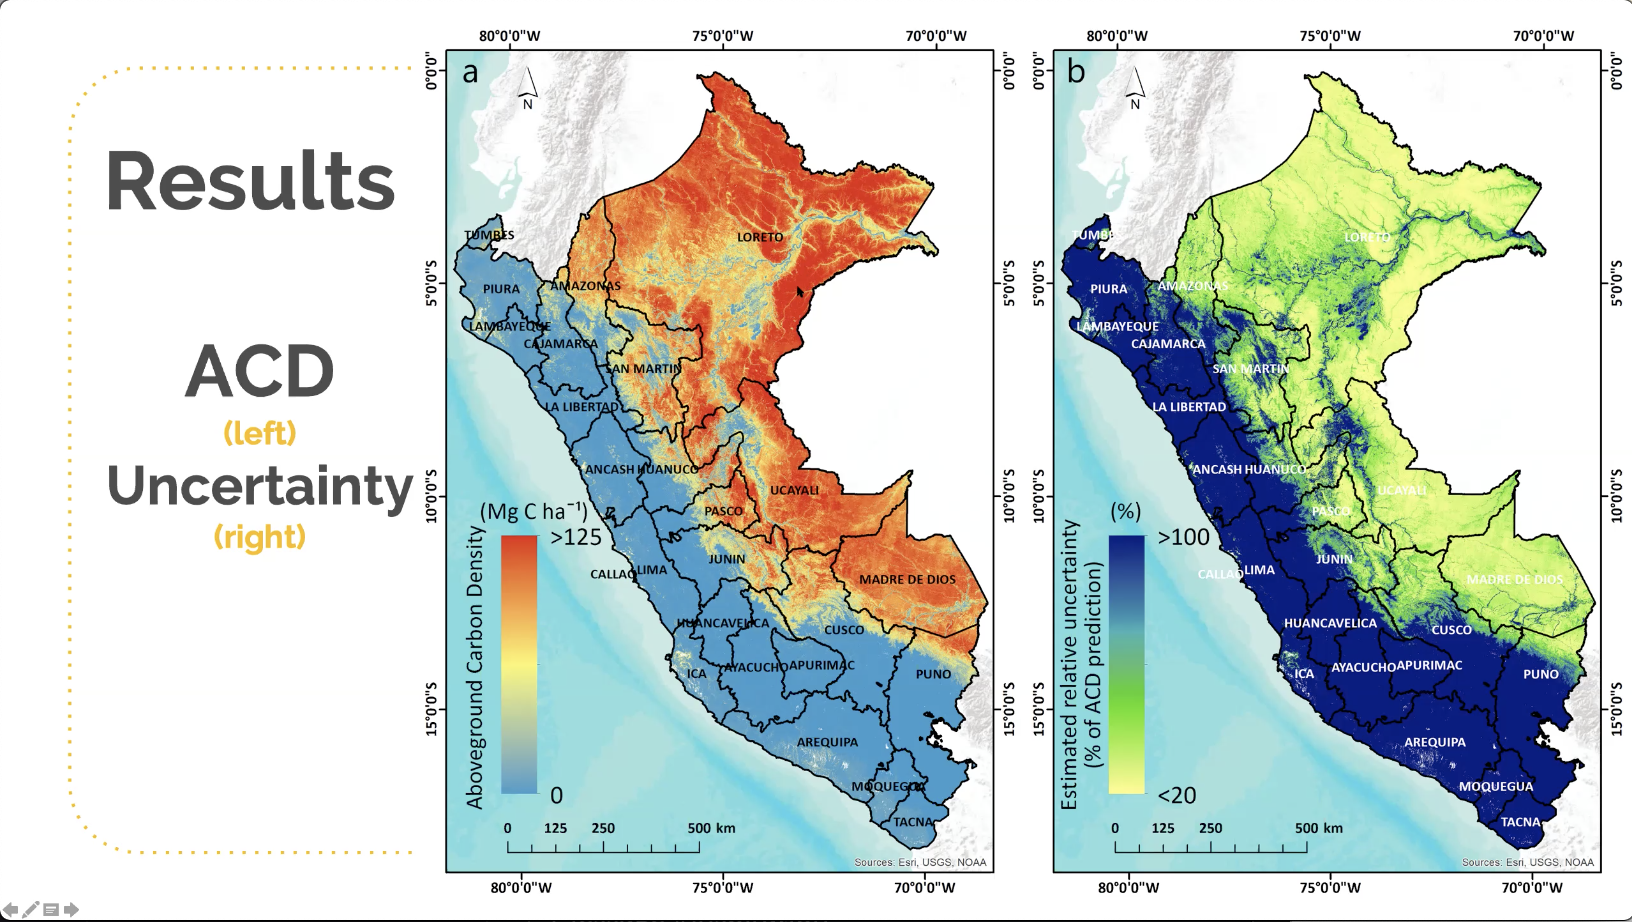
The map of Peru on the left shows aboveground carbon density, where reds are high carbon stocks and blues are very low. Image credit: Courtesy of Greg Asner
The team eventually succeeded in making the match between airborne laser data and satellite imagery, moving from traditional LANDSAT data to Planet Dove data. The Planet company designs and manufactures miniature satellites called “Doves” that are equipped with a high-powered telescope and camera programmed to capture different parts of the Earth. The Dove observation satellites continuously scan Earth, sending data once it passes over a ground station. The disadvantage of traditional LANDSAT satellites is the data lag, it takes about 16 days for data to collect creating potential gaps in carbon monitoring. Planet Dove data, on the other hand, allowed Asner’s team to see Peru every day with images at high frequency.
With the Planet Dove data scaled up with the laser data and using pattern recognition software, the team created a forest carbon stock map that visibly showed high and low carbon stocks, as pictured above. Using these techniques with Planet Dove data trained with airborne lidar, the team has the potential to routinely make carbon assessments for a country of any size. Peru, as the focus of the webinar, had 6.9 Pg (billion metric tons) of total aboveground carbon in 2017, compare this to the amount of above ground carbon that is protected, 2.9 Pg.
Asner poses a question “What happens if you go from once in a while looking at the forest from above to something that is more structured? What does that do to your carbon emissions estimates?” They looked at precisely that in Peru in a series of quarters then looked at the months within. This process took nearly 600 thousand satellite images and nearly 300 trillion airborne LiDAR points alongside high performance computing. This assessment with high resolution images and Planet Dove’s satellite data increased the annual emissions estimate in Peru between 2017-2018.
Their findings, 20.1 Tg (trillion metric tons) of carbon were 23.4% higher than FAO’s Global Forest Resource Assessment findings. By analyzing data from annually to quarterly, emissions increased 83% higher than the annual percent. Shockingly, by doing a monthly analysis, the carbon emissions were 33.8% higher in carbon estimates. This is due to the changing landscape of the regions, with lightweight vegetation that covers parts of the Earth which fools satellites and skews carbon estimates. As technology advances and Asner’s team trains satellite images with LiDAR, his technique has the potential to accurately depict a country’s carbon stock estimate and help shape climate change policy to be more efficient and action oriented.
Explore similar content

Subscribe to receive monthly updates on climate solutions, environmental heroes, and the profound beauty and wonder of our shared planet Earth.