The technology empowering Indigenous Peoples and local communities to map their lands
Despite the increasing monitoring capabilities of Earth observation satellites, there is much that we don’t know about what is happening on the ground around the globe. This is true even for places that are critical for our understanding of emerging crises, such as droughts, or about places where we need to understand changes in local ecology. Bridging this ground data gap requires building more inclusive planetary-scale monitoring systems where local people have access to locally relevant information and are remunerated for monitoring the Earth.

Figure 1 Intelligent planetary-scale monitoring systems.
To demonstrate the potential of the ground data generated by local people, this blogpost reports on an ongoing pilot project with agro-pastoralists communities in South West Ethiopia. The project started in 2021 and expanded in 2023 in collaboration with the Humanitarian OpenStreetMap Team in East & Southern Africa and the OpenStreetMap Ethiopia team.
The most pressing interconnected issues that the people face are water and food insecurity and conflict. The main causes are drought and the negative impacts of dam construction on flood recession agriculture – for more information about the context and the conceptualisation see Stevenson et al. (2022) and Moreu et al. (2022). The socio-technical process can be summarised as follows. Local people decide what they want to map and with whom they want to share the data. Then, the socio-technical system is co-designed with the stakeholders, and the mapping and information sharing process starts, with remuneration for participation. Figure 2 depicts a few local people mapping their land during a community gathering where people share knowledge and technology.
.png)
Figure 2 A group of Nyangatom agro-pastoralists mapping their land in a community gathering using the satellite imagery-based demarcation functionality (May 2023).
The use of AI-generated information (e.g. ChatGPT) for addressing pressing issues such as water and food security will likely increase rapidly in the coming years, especially among emergent users. However, AI systems will not replace existing peer-to-peer information sharing technologies (e.g. WhatsApp groups) because trusted peers are often the most reliable sources of information. Figure 3 shows how the mobile app links messaging and mapping by bringing messaging (or conversations) to mapping apps, and mapping to messaging apps. This was first piloted in 2021, when chatbots were not so popular (see “Land use messaging & mapping for collaborative Climate-smart Agriculture in Nigeria”). If we look at the left side of figure 3 below, the farming advice in the blue dialog was provided by an agricultural extension officer. Future work will explore how an AI can be part of the conversation in this and similar contexts.
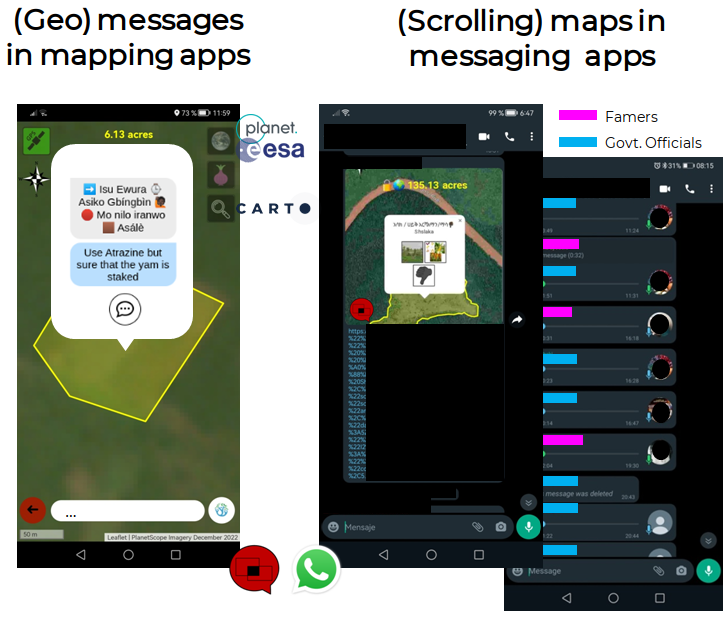
Figure 3 On the left, a farmer reporting an issue using the mapping app and an agricultural extension officer provides farming advice. On the right, a map contribution in WhatsApp followed by an audio conversation.
The mobile app’s interfaces for creating and describing a geometry and the map data generated by local people are shown in Figures 4 and 5. To ensure multi-stakeholder engagement and high scalability potential, private and open data are shared through WhatsApp, and the open data are transmitted to a central spatial database using an open-for-all approach. That is, no registration is required, and only the phone number of the contributor is recorded for mobile cash transfer purposes.
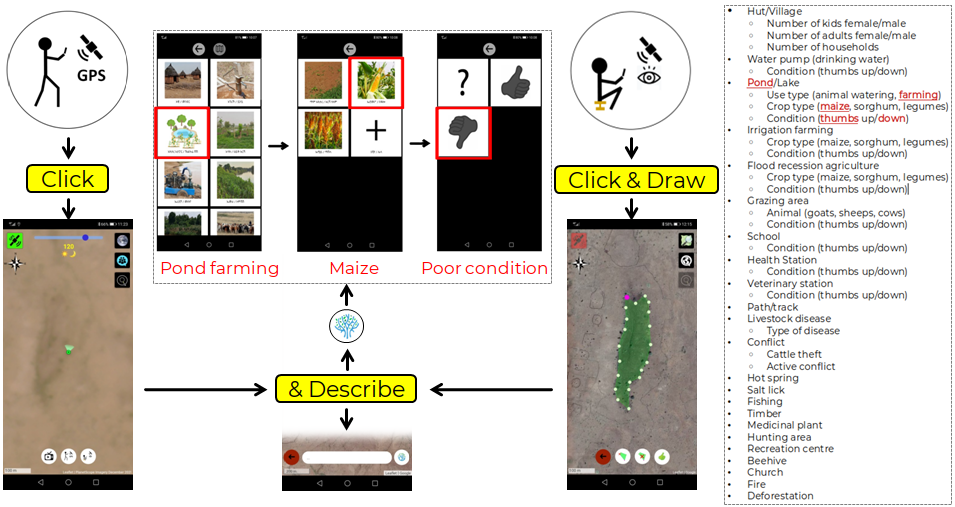
Figure 4 An example of interaction for mapping (with GPS or satellite imagery) a pond for farming maize that is in poor condition. When rains arrived after a long drought, contributors mapped improvement in the condition of cropland and grassland. On the right, the list of all the information that can be captured with the pictorial interface.

Figure 5 Mapping process and CARTO dashboard showing some of the data collected by a few Nyangatom agro-pastoralists in South West, Ethiopia.
This ground data collected through this process can be valuable for:
- Monitoring food insecurity to improve early warning systems.
- Monitoring water bodies and grazing areas to prevent conflicts and improve resilience of pastoralists.
- Monitoring the condition of water infrastructure to ensure access to clean water and irrigation schemes.
- Monitoring crops to address farming issues and improve sustainable land use practices.
- Evaluating the condition of health and veterinary stations to efficiently allocate medical resources and prevent pandemics.
- Documenting land use rights to prevent future land grab scenarios or to ensure fair compensation if resettlement.
To illustrate the semantic and spatial differences between maps made remotely and maps made by those who use the land, figure 6 compares the land user-generated map shown above with machine- and user-generated maps of the same area. Here the term ‘land user’ is used instead of ‘citizen’ or ‘user’ because whether or not (and how) the mapper uses the land being mapped matters. Remote mapping cannot capture information such as the use of a building, a pond or a (sacred) tree; or crop and livestock diseases; or biodiversity under the tree canopy; or where are the fuzzy boundaries of a grazing or hunting area; or land use rights. Understanding land use requires, fundamentally, land user-generated information.
%2C%20Google%20Maps%20and%20OSM%20data%20(centre)%2C%20and%20the%20land%20user-generated%20map%20(right).png)
Figure 6 Map comparison of the same area in South West, Ethiopia.The Google & WRI DynamicWorld Map and the ESA WorldCover Map (left), Google Maps and OSM data (centre), and the land user-generated map (right).
How accurate is the data generated by those who use the land? Figure 7 illustrates the wisdom of the crowd concept, which can be summarised as follows: the more people contributing to a map, the better the map. For more information about the wisdom of the crowd and the question ‘Precision for whom?’ see Haklay et al. (2013) and McCall (2006).
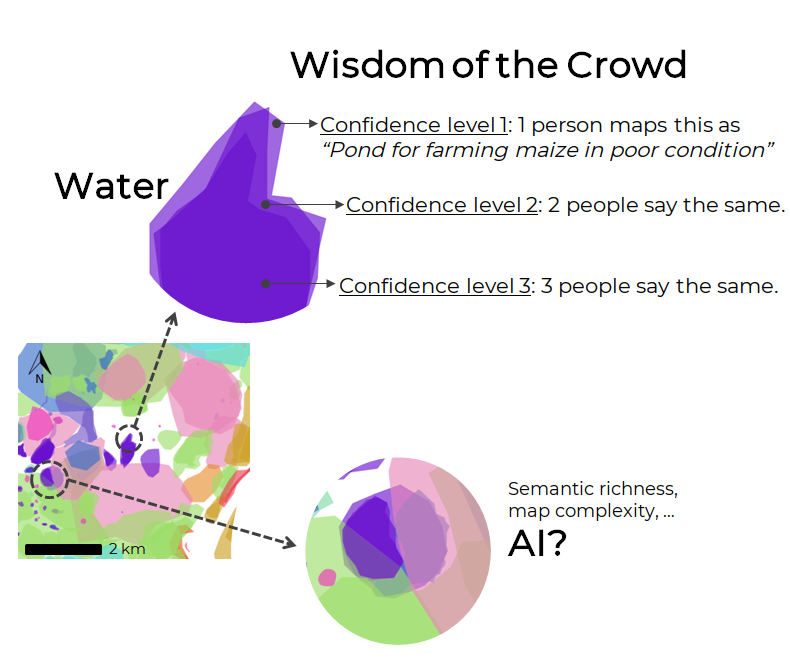
Figure 7 The wisdom of the crowd concept illustrated.
The output of the data processing when applying the wisdom of the crowd concept with confidence level 2 is shown in figure 8. In this pilot, confidence level 2 was selected because only a few agro-pastoralists are part of the mapping process. However, as the number of people contributing to the map increases, so will the completeness and the confidence level.
%20and%20processed%20land%20user-generated%20data%20(right)%20using%20wisdom%20of%20the%20crowd%20methods.png)
Figure 8 Raw (left) and processed land user-generated data (right) using wisdom of the crowd methods.
To quantify the quality of the water-related data, we compared the ponds and lakes of the processed land user-generated data with the Global Water Watch (GWW) water occurrence data generated by Donchyts et al. (2022) using remote sensing image processing algorithms. Out of the 22 features visible (excluding the river) in the GWW data, 14 of these features (green circles, see figure 9) were also mapped by the local people, and 7 were not mapped (orange circles).
Interestingly, if the processed land user-generated map was used here as reference data to assess the accuracy of the GWW map (not vice versa), then the accuracy results of the GWW map would be: 14 true positives objects (i.e. water on the reference layer mapped as water), 8 false positives objects (i.e. no water on the reference layer mapped as water), and 77 false negatives objects (i.e. water on the reference layer not mapped as water – see all the blue polygons without a circle in the map on the right). In other words, the machine-generated map omits the majority of water sources for farming and animal watering that are used by local people.
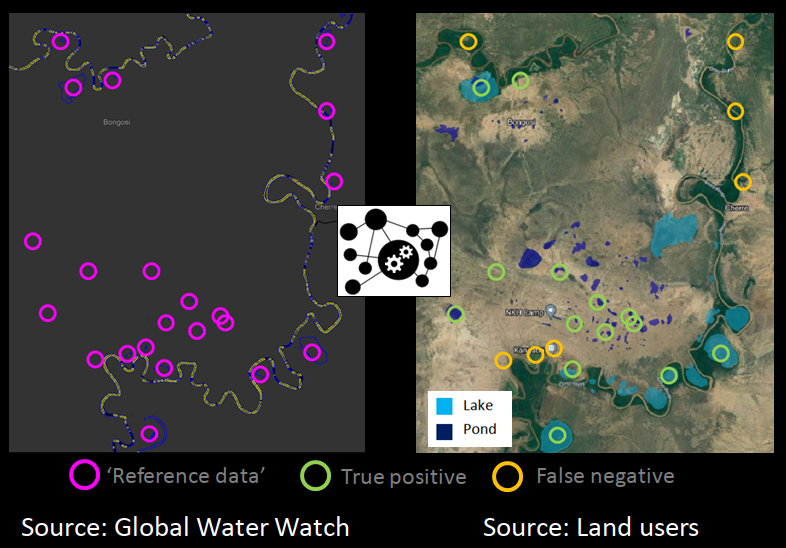
FIgure 9 Comparison of the GWW data with the lake and pond polygons mapped by the local people.
Our work to date highlights the need to transition towards complete planetary-scale monitoring systems that recognise and remunerate the wisdom of the crowd, especially at the margins, where billions of people live.
The ground EO data described here is available upon request and will be made open in vector and raster format in early 2024. Please email us at [email protected] if you are interested in exploring and using the data.
This project was funded by the European Research Council (Advanced Grant Agreement No. 694767), UK Research and Innovation (UKRI), FORMAS and UCL Grand Challenges. Thank you also to CARTO, the European Space Agency, Planet and Sinergise for providing free access to cloud services and satellite imagery.
.png?auto=compress%2Cformat&w=1440)
